Results
Read the numbers for a placement's A/B test and holdout, and learn how each figure is computed.
Use the Results tab to see whether a screen change or a placement really brings more purchases. It has two blocks: A/B test and Holdout. The tab reads figures the API computes. It does not have a save bar and you can open it with Viewer access.
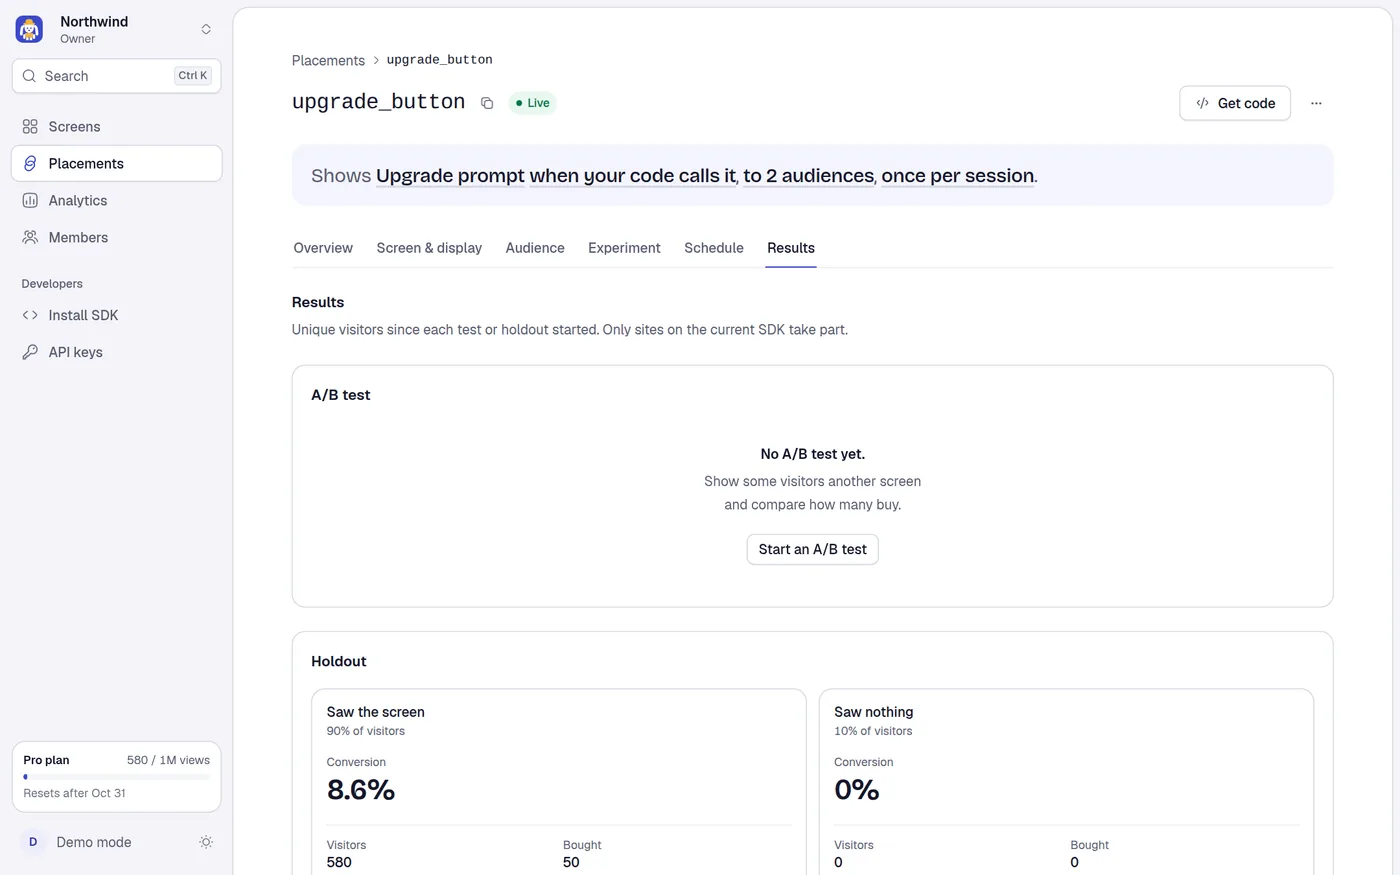
The note under the title says: Unique visitors since each test or holdout started. Only sites on the current SDK take part.
If the placement has never had a test and has no holdout, the tab shows one empty state, No results yet., with Start an A/B test and Set a holdout buttons. If only one of the two exists, the other block says No A/B test yet. or No holdout set. with a button to start one.
For placement-independent numbers (views per day, button presses, answers) see Analytics.
A/B test block
The block shows the running test, or the latest one that ended. A badge says Running, or Ended 3 days ago · B won.
Each side is a card with:
| Figure | What it counts |
|---|---|
| Name and share | The screen's name, and 50% of visitors. |
| Conversion | Bought divided by Visitors, as a percentage. |
| Visitors | Unique visitors who were shown this side (a view event). |
| Tapped buy | Unique visitors who tapped a purchase button. |
| Bought | Unique visitors with a purchase. A purchase counts when onPurchase finishes without returning false, or when your site calls reportPurchase(). |
Below the cards, two bars compare the conversion rates. The longer bar is drawn in the brand colour and the other in grey. An A leads or B leads badge appears on a side when the evidence is strong (95% or more).
The sentence under the cards
It reads the result in plain words:
| Situation | Sentence |
|---|---|
| Either side under 100 visitors | Too early to call. Each screen needs at least 100 visitors (A has 40, B has 38). |
| 95% or more chance B is better | B is very likely better: 97% chance it converts more. |
| 5% or less chance B is better | A is very likely better: 96% chance it converts more. |
| In between, test running | No clear winner yet. B has a 62% chance of converting more; keep the test running. |
| In between, test ended | No clear winner. B had a 62% chance of converting more. |
The chance figure is the probability that B's true conversion rate is higher than A's. The API computes it with a normal approximation of the difference between two proportions: it takes each side's conversion rate and visitor count, works out the standard error of the difference, and reads the probability from the normal curve. 50% means no evidence either way, and it stays 50% while either side has no visitors. It is an aid to reading, not a guarantee. Keep a test running until each side has a good number of visitors.
Started DATE. shows when the test began.
Past tests
Earlier tests that ended appear under Past tests, one line each: Annual vs Monthly, then A 3.2% · B 4.1% · kept B.
Holdout block
The block compares visitors who saw the screen with visitors who were held out and saw nothing. It appears when the placement has a holdout share saved. See Audience: holdout.
| Group | Visitors | Bought |
|---|---|---|
Saw the screen (100 minus the share of visitors) | Unique visitors with a view of this placement since the holdout started | Unique visitors with a reported purchase |
| Saw nothing (the held-out share) | Unique visitors the SDK recorded as held out | Unique visitors whose purchase was reported by reportPurchase() after being held out |
Each card shows Conversion (Bought divided by Visitors), Visitors and Bought. A footer says Measured since DATE.
The sentence under the cards:
| Situation | Sentence |
|---|---|
| Either group under 100 visitors | Too early to tell. Each group needs at least 100 visitors (shown: 80, held out: 12). |
| 95% or more chance the screen helps | The screen very likely brings more purchases: 97% chance. with a Screen helps badge |
| 5% or less chance | Visitors who saw nothing bought more: 96% chance the screen does not help. |
| In between | No clear difference yet: 70% chance the screen brings more purchases. |
The chance uses the same formula as the A/B test, with "saw the screen" in the role of B.
The figures are only trustworthy if your site calls reportPurchase() for every purchase, including those by visitors who never saw the screen. If it does not, the held-out group shows no buyers and the screen looks better than it is. See Purchases in the SDK.
Changing the holdout share starts the measurement again.
Why a number may be missing or low
- Only paywalls loaded by placement key are counted. A paywall loaded by paywall ID, JSON or URL sends no test events.
- Turning analytics off in the SDK (
configure({ analytics: false })) stops all events, so no results. - Events are sent in batches about 2 seconds after they happen, or when the visitor leaves the page.
- A visitor is a random ID kept in one browser. Someone on two browsers counts twice.
- Previews from the dashboard, and visitors skipped by a frequency limit or by an audience set to Nothing, are not counted as views.
- Visitors who clear their browser data become new visitors.