Analytics
Read how many visitors saw each screen, tapped buy, bought, pressed a button or answered a question, and how each number is counted.
Use Analytics in the sidebar to see how your screens perform on your live site: how many people saw each screen, how many tapped a purchase button and how many bought. For onboarding screens and surveys it also shows which buttons people pressed and which answers they chose.
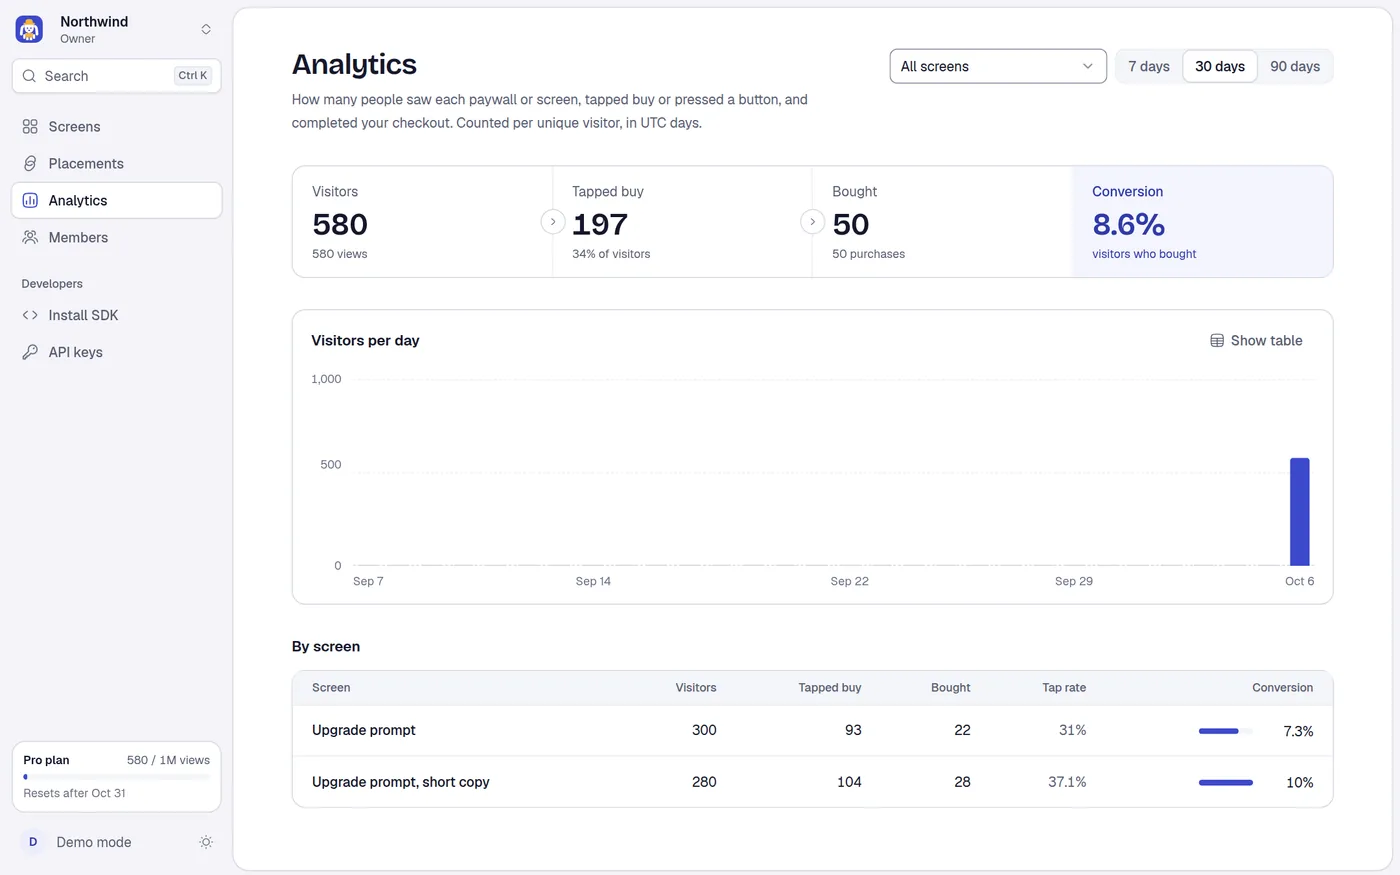
The numbers come from events that the Web SDK sends from your visitors' browsers. Anyone with Viewer access to the project can read the page.
The page only has data once your site shows a screen loaded from a placement or a paywall ID. Screens loaded from a JSON file or a URL, and sites that turn analytics off, send nothing. In the browser-only demo the page says Analytics need an account. See Events and privacy in the SDK.
Filters
Two controls sit at the top right. They are saved in the page address as ?paywall= and ?days=, so you can share a view.
| Control | Options | Default |
|---|---|---|
| Paywall menu | All screens, or one screen by name | All screens |
| Date range | 7 days, 30 days, 90 days | 30 days |
While new numbers load, the last numbers stay on screen, dimmed.
- The range is the last 7, 30 or 90 times 24 hours up to now. The daily chart shows that many UTC days ending today, so its first day may be only partly counted.
- How far back your data goes depends on your plan: 30 days on Free and Indie, 90 days on Pro and Team. See Plans and billing.
Empty states
- No views in the range: No views yet, or No views for NAME yet when a screen is selected, with an Install the SDK button. The text reminds you that the SDK reports views, buy taps and purchases on its own once your site shows a screen from a placement or paywall ID, and that if checkout finishes on another page you call
reportPurchase()there. - Loading fails: an error with a Retry button.
The four numbers
The strip at the top counts unique visitors over the whole range.
| Tile | Value | Detail line | How it is counted |
|---|---|---|---|
| Visitors | Number | N views | Distinct visitor IDs that have a view event. The detail line counts all view events. |
| Tapped buy | Number | N% of visitors | Distinct visitor IDs with a purchase_click event. The percentage is Tapped buy divided by Visitors (the tap rate). |
| Bought | Number | N purchases | Distinct visitor IDs with a purchase event. The detail line counts all purchase events. |
| Conversion | Percentage | visitors who bought | Bought divided by Visitors. |
What this means in practice:
- A visitor is a random ID the SDK keeps in the browser (not a person or an account). The same person on two browsers is two visitors, and someone who clears their data becomes a new visitor.
- A view is one screen shown. Each screen of a multi-screen flow is a view. Views are also what your plan's monthly limit counts. Previews from the dashboard, and visitors skipped by a frequency limit, an audience set to Nothing or a holdout, are not views.
- Tapped buy is recorded when a visitor taps a purchase button. Bought is recorded when your
onPurchasefinishes without returningfalse, or when your site callsreportPurchase(). If Bought stays at zero, your site is not reporting purchases. - Each number counts visitors that have that kind of event in the range. They are counted separately, so a visitor whose view fell before the range but who bought inside it counts under Bought only.
- Events reach the page within a few seconds. The SDK sends them in batches about every 2 seconds and when the visitor leaves the page.
Visitors per day
A column chart of Visitors for each UTC day. Use the chart to spot a launch, a drop after a release, or a quiet weekend.
- The y-axis maximum is rounded up to 1, 2 or 5 times a power of ten (at least 2). Gridlines mark the maximum, half and zero.
- A day with no visitors draws a thin line so the day still shows on the timeline.
- Hover or focus a column for a tooltip: the day,
N visitors · N bought. - Show table switches to a table with the columns Day, Visitors and Bought, newest day first. Show chart switches back.
- A day's Visitors counts distinct visitors that day, so the daily numbers do not add up to the strip's total (a person who returns on three days counts once in the total and once per day).
Button presses
Shown when any "Run your code" button was pressed in the range. Use it to read completion on onboarding screens, permission prompts and surveys.
| Column | Meaning |
|---|---|
| Screen | The screen. Shown only when the filter is All screens. |
| Action ID | The ID you set on the button in the editor, such as get_started. |
| Visitors | Distinct visitors who pressed it. |
| Share of visitors | Visitors divided by the visitors of that screen. A get_started button on a welcome screen reads as the completion rate. |
| Presses | Total presses. |
Rows are sorted by Visitors, and the table shows at most 50 rows.
Answers
Shown when visitors answered questions on a screen that has questions (single choice and multiple choice). There is one card per question, sorted by the number of people who answered.
Each card shows the Field ID (and the screen name when the filter is All screens), N answered, and one row per answer: the Answer ID, a bar, the share and the number of visitors, for example 42% · 128.
- N answered is the number of distinct visitors who answered that question, once, even if they chose several options.
- A share is visitors who chose this option divided by N answered. For a multiple choice question the shares can add up to more than 100%.
- Only chosen options are counted. Text typed into a Text field is never sent to Miniwall, so it never appears here. Your site receives it in
answers. See Answers in the SDK. - An option is counted when the visitor moves on, closes, buys or presses a button, once per visitor per option.
- The page shows up to 200 answer rows across all questions, most chosen first.
By screen
With All screens selected, a table lists each screen that had events in the range, most visitors first.
| Column | Meaning |
|---|---|
| Screen | The screen name (select it to filter to that screen). A deleted screen reads Deleted paywall. |
| Visitors | As above, for that screen. |
| Tapped buy | As above. |
| Bought | As above. |
| Tap rate | Tapped buy divided by Visitors. |
| Conversion | Bought divided by Visitors. The bar compares each row with the best row. |
By published version
With one screen selected, this table breaks it down by published version (v1, v2, newest first) with the same columns. Use it to see whether a new publish helped. Events that arrived without a version number show as Unknown.
What is not here
- A/B test and holdout comparisons live on the placement's Results tab, because they need the placement's own groups.
- Revenue is not shown. Miniwall does not process payments, so it never sees an amount. It counts purchases your site reports.